Introduction
If you’ve ever stared at a cryptic error message from a CLI tool wondering “What HTTP requests is this thing actually making?”, you’re not alone. Whether it’s a failed git clone, a mysterious npm install error, or tracking claude code for finding prompts, finding out what data your application sends to third-party services, understanding HTTP traffic is crucial for modern development. Enter HTTP Toolkit – an open-source powerhouse that makes intercepting and debugging HTTP traffic almost effortless.
What is HTTP Toolkit?
HTTP Toolkit is a cross-platform, open-source tool for debugging, testing, and building with HTTP on Windows, Linux, and Mac. Think of it as a sophisticated HTTP proxy with a beautiful interface that lets you see exactly what’s happening on the wire – without the complexity of traditional network analysis tools.
Why HTTP Toolkit Stands Out
Unlike traditional network debugging tools that capture everything on your machine (creating noise and potential side effects), HTTP Toolkit offers targeted interception. You can capture traffic from:
- Individual browser windows
- Specific mobile apps (Android/iOS)
- Backend processes (Node.js, Python, Ruby, Java, PHP)
- Docker containers
- Terminal sessions (the star of our show today)
- And more
This precision means you see only the traffic you care about, making debugging faster and more effective.
The Power of Terminal Interception
Terminal interception is one of HTTP Toolkit’s most powerful features. Here’s why it’s game-changing:
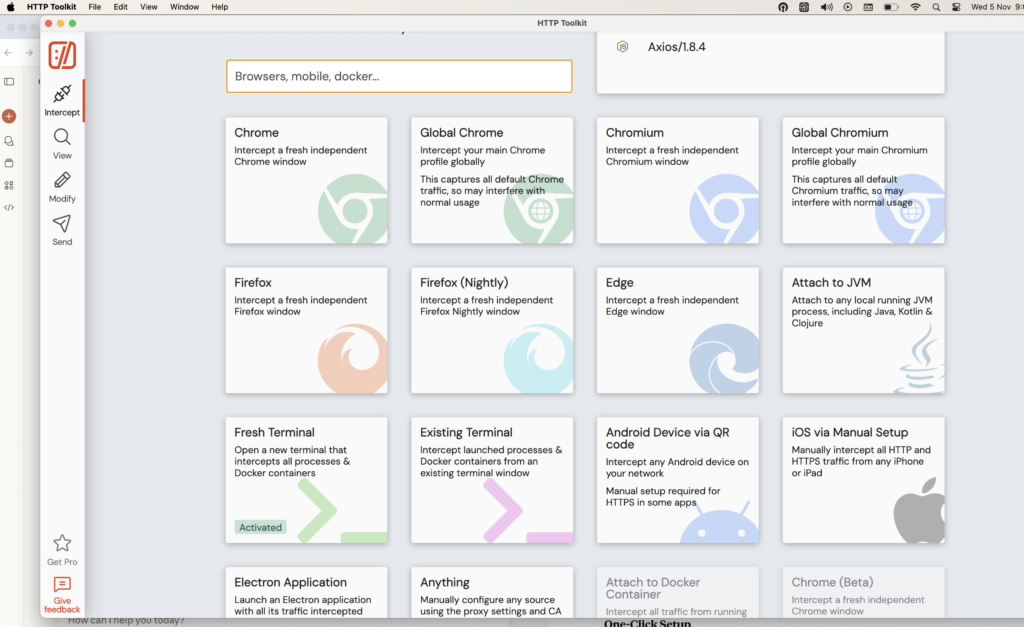
One-Click Setup
Getting started is ridiculously simple:
- Install HTTP Toolkit
- Open the application
- Navigate to the Intercept page
- Click the “Terminal” or “Fresh Terminal” button
- A new terminal window opens, pre-configured to route all HTTP traffic through HTTP Toolkit
That’s it. No complex proxy configuration, no certificate installation headaches, no environment variable tweaking. HTTP Toolkit handles all of that automatically.
What Gets Intercepted?
Once you launch an intercepted terminal, the vast majority of CLI tools and languages automatically use HTTP Toolkit’s proxy and trust its certificate. This includes:
- Version control:
git clone,git push,git pull - Package managers:
npm install,pip install,apt-get update,gem install - HTTP clients:
curl,wget,http - Cli tools : claude code, gemini cli, codex
- Language runtimes: Node.js scripts, Python applications, Ruby programs
- And many more: Most tools that respect standard environment variables
This works through a combination of:
- Environment variables like
HTTP_PROXYandHTTPS_PROXY - PATH modifications to wrap certain commands
- Automatic certificate trust configuration
Two Flavors of Terminal Interception
HTTP Toolkit offers two approaches:
1. Fresh Terminal Launches a new terminal window completely preconfigured for interception. This is the most reliable option and ensures everything is set up correctly from the start.
2. Existing Terminal Provides a copyable command that you can paste into any existing terminal window to enable interception on the fly. This is incredibly convenient when you’re already working in a terminal and don’t want to switch contexts.
Available for:
- Bash
- Fish
- PowerShell
Real-World Use Cases
Let’s explore some practical scenarios where terminal interception shines:
1. Understanding claude code system prompts

2. Understanding how git clone works
git clone https://github.com/example/repo.git3. Security and Privacy Auditing
Concerned about what data your CLI tools might be sending to analytics services?
With terminal interception, you can:
- See if tools are tracking your usage
- Identify unexpected third-party connections
- Verify that sensitive data isn’t being transmitted
- Ensure applications respect your privacy settings
4. API Development and Testing
When building applications that consume APIs:
# Run your Python script</em>
python api_client.py

# Execute your Node.js application</em>
node index.js
You can see every API call your code makes, including:
- Request/response headers
- Query parameters
- Request bodies
- Response data
- Timing and performance metrics
Advanced Features for Terminal Users
Breakpoints and Live Editing
HTTP Toolkit isn’t just for passive observation. You can:
- Set breakpoints on matching requests
- Pause live traffic for manual editing
- Modify requests on the fly (URLs, methods, headers, bodies)
- Mock responses without forwarding to the real server
- Inject errors and timeouts to test error handling
This is invaluable for testing how your applications handle various scenarios without actually having to create those conditions in your backend.
Powerful Inspection Tools
Every captured request shows:
- Complete URL with parsed query parameters
- HTTP method and status code
- All request and response headers (with MDN documentation inline)
- Full request and response bodies with:
- Syntax highlighting for JSON, XML, HTML, JavaScript, and more
- Base64 decoding
- Protobuf parsing
- Hex view
- Automatic formatting and pretty-printing
The interface is built on Monaco – the same editing engine that powers Visual Studio Code – so you get professional-grade tools for examining HTTP traffic.
Filtering and Search
When you’re debugging complex issues, you need to find the needle in the haystack. HTTP Toolkit provides:
- Content-type categorization (images, JSON, errors, etc.)
- Source tagging (which client sent which traffic)
- Free-text search across all request/response data
- Structured filtering by URL, status, headers, and more
Docker Integration
HTTP Toolkit also excels at intercepting Docker containers launched from terminal:
bash
# In an intercepted terminal</em>
docker run my-container

# Or with Docker Compose</em>
docker-compose up
All HTTP traffic from the container is automatically captured. You can also attach to already-running containers through the UI for dynamic interception.
Technical Implementation
For those curious about how it works:
HTTP Toolkit primarily uses environment variables like HTTP_PROXY that many tools and frameworks check automatically. When you launch an intercepted terminal:
- A proxy server starts (if not already running)
- Environment variables are set pointing to this proxy
- The PATH is modified to wrap certain commands
- Certificate trust is configured
- Changes are inherited by subprocesses
For the “Existing Terminal” option, the tool generates shell-specific commands that apply these same settings to any running terminal session.
Getting Started
Ready to try it? Here’s the quick start:
- Download: Visit httptoolkit.com and download for your platform
- Install: Follow the standard installation process
- Launch: Open HTTP Toolkit from your applications menu or run
httptoolkitfrom the command line - Intercept: Click “Fresh Terminal” on the Intercept page
- Explore: Run any command and watch the traffic appear in the View page
That’s literally it. Within minutes, you’ll be intercepting and analyzing HTTP traffic like a pro.
HTTP Toolkit transforms HTTP debugging from a frustrating guessing game into a transparent, visual experience. Terminal interception specifically opens up a world of understanding for CLI tools, build processes, and command-line workflows.
Whether you’re debugging a failing API integration, learning how network protocols work, auditing privacy concerns, or testing error handling, HTTP Toolkit’s terminal interception gives you the visibility you need.
Resources:
- Official Website: httptoolkit.com
- GitHub: github.com/httptoolkit/httptoolkit
- Documentation: httptoolkit.com/docs